
If you have been following developments in the Microsoft data space, you will have noticed a lot of noise around Microsoft Fabric. You may also have noticed that Power BI is now described as being ‘part of Fabric’ — which raises an obvious question for anyone who has invested in Power BI: what has actually changed, what does Fabric add, and do you need to migrate?
The Microsoft Fabric vs Power BI question is one of the most common points of confusion for Australian IT managers and BI managers right now. This article provides a clear, practical answer.
The Core Distinction: Scope
The most important thing to understand about the Microsoft Fabric vs Power BI comparison is that they are not competitors. They operate at different layers of the data stack.
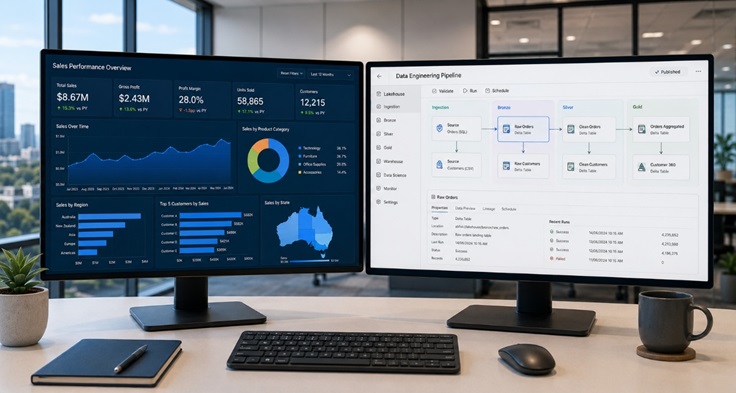
Power BI is a business intelligence and data visualisation platform. It connects to data sources, models data, and surfaces insights through interactive reports and dashboards. It is excellent at what it does and remains the dominant BI tool for Australian organisations.
Microsoft Fabric is a unified analytics platform that encompasses Power BI but extends far beyond it. It includes data engineering, data integration, data science, real-time analytics, and data warehousing — all built on a shared data foundation called OneLake. Power BI is one workload within Fabric, not a competing product.
The analogy that helps most people: Microsoft 365 contains Word, Excel, and Teams. You would not ask whether Microsoft 365 or Word is better — they operate at different levels. Fabric and Power BI have a similar relationship.
What Power BI Does Well
Before examining what Fabric adds, it is worth being clear about where Power BI delivers genuine value — because the fundamentals have not changed.
Power BI excels at connecting to data sources, transforming that data through Power Query, building semantic models with DAX measures and calculated tables, and surfacing those models through interactive reports and dashboards. The Power BI service provides sharing, collaboration, scheduled refresh, and row-level security at scale.
For organisations whose primary analytics need is reporting and visualisation — connecting to existing databases, cloud applications, or flat files and producing dashboards that business users can explore — Power BI remains one of the best tools available, at any price point.
Where Power BI has traditionally been limited is in the layers beneath the visualisation. Managing large-scale data ingestion, building complex transformation pipelines, orchestrating multi-source data engineering workflows, and handling real-time streaming data have all required additional tools outside the Power BI ecosystem.
What Microsoft Fabric Adds
Fabric’s central contribution is integrating those additional layers into a single environment. The key capabilities that Fabric adds beyond what Power BI provides natively include:
- Data Factory integration: visual and code-based data pipelines for ingestion and orchestration
- Data Engineering with Apache Spark: large-scale data transformation using notebooks and lakehouse architecture
- Data Warehouse: a fully managed, cloud-native SQL data warehouse with T-SQL support
- Real-time Intelligence: streaming analytics for event-driven data sources
- Data Science: integrated ML experimentation using notebooks, connected to the same data estate
- OneLake: a single, tenant-wide data lake that all Fabric workloads share, eliminating data duplication
The significance of OneLake is easy to underestimate. In traditional architectures, data is copied between systems as it moves through the pipeline — from source systems into Azure Data Lake, from there into Azure Synapse, from Synapse into Power BI datasets. Each copy introduces latency, potential inconsistency, and storage cost. OneLake means all Fabric workloads operate against the same underlying data, reducing duplication and improving consistency.
When Should You Use Power BI Alone vs Fabric?
The decision is largely a function of data complexity and organisational ambition.
Power BI alone is sufficient when your data sources are already well-structured and accessible (databases, cloud applications, APIs), when your transformation requirements are modest and Power Query handles them adequately, when you do not have significant data engineering or data science workloads, and when your data volumes are manageable within Power BI’s semantic model constraints.
Fabric becomes relevant when you are managing large data volumes that require distributed processing, when you need to build and maintain complex data pipelines across multiple source systems, when data science or machine learning workloads need to be integrated with your analytics environment, when real-time data processing is a requirement, or when you want to consolidate a fragmented Azure data stack into a single managed platform.
Most mid-size Australian organisations do not need the full Fabric stack on day one. A phased approach — starting with Power BI and building toward Fabric as data requirements grow — is a common and sensible path, and it is one that experienced Microsoft Fabric consulting can help you design from the start so that your early decisions do not create obstacles later.
Licensing: How the Models Differ
Power BI licensing operates on a per-user model (Pro or Premium Per User) with an optional Premium capacity for shared workloads and larger audiences. This model is familiar and reasonably straightforward for most organisations.
Fabric licensing is capacity-based, measured in Fabric capacity units (CUs). Capacity is purchased and shared across all Fabric workloads — data engineering jobs, data warehouse queries, real-time analytics, and Power BI reports all draw from the same pool.
For organisations already on Power BI Premium, the transition to Fabric capacity is relatively smooth — Premium capacities have been migrated to Fabric capacity. For organisations starting fresh, the capacity model requires a more careful sizing exercise to avoid over- or under-purchasing.
The Data Analytics and Visualisation Perspective
Both Power BI and Fabric are fundamentally about delivering better data analytics and visualisation outcomes for organisations. The difference is the scope of the data problem being solved. Power BI is the right tool when the visualisation layer is the gap. Fabric is the right choice when the entire data engineering and analytics lifecycle needs to be addressed.
Australian organisations in healthcare, mining, aged care, and finance are particularly well-placed to benefit from Fabric’s unified governance model, which integrates Microsoft Purview for data lineage, cataloguing, and access policy management across the entire data estate — not just the BI layer.
Making the Right Call for Your Organisation
If you are currently using Power BI and it is working well, you do not need to migrate to Fabric immediately. Your reports, semantic models, and workspace configurations all carry forward into the Fabric environment — this is by design.
If you are evaluating both platforms from a standing start, the question to ask is: what does your data problem actually look like? If it starts and ends with reporting, a well-implemented Power BI environment with solid Power BI consulting support is the right starting point. If your ambitions extend into data engineering, real-time analytics, or machine learning, designing for Fabric from the beginning avoids a costly architectural rework later.
Conclusion
The Microsoft Fabric vs Power BI question resolves quickly once the scope difference is understood. They are not alternatives — they are layers. Power BI handles reporting and visualisation. Fabric handles the entire analytics and data engineering lifecycle, with Power BI as its front end.
For Australian organisations navigating this landscape, the practical question is not which to choose, but where your organisation currently sits on the data maturity curve and which investment makes sense at this stage. Getting that assessment right is the starting point for any data platform decision worth making.